

Under the direction of the Ministry of Railways of the Government of India, IRCON International Limited, formerly known as Indian Railway Construction Limited, is a top turnkey construction firm.
Operating under the Ministry of Railways, this government owned company has performed well in India, Malaysia, Nepal, Bangladesh, Mozambique, Ethiopia, Afghanistan, the United Kingdom, Algeria, and Sri Lanka.
The company's stock was listed on BSE in 2018, and after that, its performance remained normal. However, after the government policy in 2023, the company's stock saw an excellent impact and grew by 180% in a year and 50% in just six months.
Government laws and policies that impact the company's operations domestically and internationally determine the target price of IRCON shares. Today through this post we will forecast the IRCON share price target and the elements affecting it in the future.
About Ircon Company
IRCON International, also known as Indian Railway Construction International Limited, is a transportation infrastructure-focused engineering and construction company based in India. As per the Indian Companies Act 1956, Indian Railways established the public sector enterprise in 1976.
IRCON, a wholly owned subsidiary of Indian Railways, was first incorporated as Indian Railway Construction International Limited. Its main activity was to construct railway projects in India and elsewhere. Since then, IRCON has grown into other infrastructure and transportation-related industries. In October 1995, the company changed its name to Indian Railways International Limited to reflect its global activities.
Ircon Shares Current Performance And Market Indicators
Open Price: ₹239.30
Today's Low Price: ₹234.60
Today's High Price: ₹240.90
Current Price: ₹239.70
Market capitalization: ₹22,398 crore
P/E Ratio: 23.19
ROE: 15.83%
Dividend Yield: 1.30%
52-Week Low: ₹127.25
52-Week High: ₹351.60
Price Change Over the Past Year: ₹70.40 (41.41% Increase)
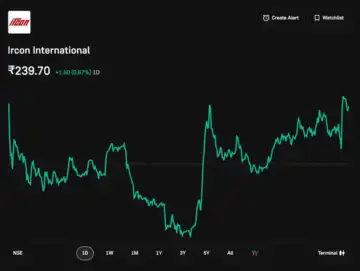
IRCON shares have performed well in the market and they are currently trading at ₹239.70. During the day, the stock rose from an opening price of ₹239.30 to a high of ₹240.90 while hitting a low of ₹234.60. IRCON has shown strong growth, as can be seen from its price increase of 41.41% over the last year, which represents a gain of ₹70.40. The market value of the company is ₹22,398 crore.
The stock's return on equity (ROE) of 15.83% indicates that shareholder equity is managed efficiently, and its P/E ratio of 23.19 indicates a modest value. IRCON also pays a dividend of 1.30% to investors, ensuring consistent income. There is still room for growth or correction, as the stock price is still well above its 52-week low of ₹127.25 but well below its 52-week high of ₹351.60.
Ircon Share Price Target 2024
The current stock market trend is likely to continue with some degree of volatility, and the share price of IRCON International may reach Rs. 316 per share by the end of the year 2024.
Ircon Share Price Target 2025
By 2025, IRCON is expected to gain momentum from existing initiatives and win new contracts. As a result, it is estimated that the IRCON share price target will range from ₹315 to ₹454 in 2025. This growth is anticipated to be driven by strong revenue growth from both local and international projects and a focus on improving operational efficiency.
Ircon Share Price Target 2026
The share price of IRCON is expected to be Rs 569.21 per share in 2026. For the rapid growth of the company in the future, IRCON is continuously expanding in several growing business areas other than railway construction activities.
Ircon Share Price Target 2027
IRCON is working on several important projects, which will probably take some time to complete, as can be seen from a detailed analysis of its activities. The minimum target price for IRCON shares in 2026 is ₹576, while the maximum target price is ₹654.
Ircon Share Price Target 2028
IRCON's growth momentum is expected to remain favorable until 2028. IRCON share price target for 2028 is estimated to be between ₹670 and ₹760. This forecast is based on IRCON's continued success, its ability to secure significant projects, and its expansion into international markets.
Ircon Share Price Target 2029
A smaller time frame indicating a reversal indicates that profit booking is possible in the future, which is a good sign for a healthy move. The IRCON share price target for the year 2029 is estimated to be ₹870 per share. Additionally, depending on the trend, it may take some time for the price to retest the average position on a larger time frame.
Ircon Share Price Target 2030
By 2030, IRCON is projected to become a significant player in the global infrastructure sector due to its background and performance. By 2030, the IRCON share price is expected to fluctuate between ₹900 to ₹999. This long-term projection is based on the assumption that IRCON will continue to expand its customers, obtain profitable contracts, and use cutting edge project management strategies.
Ircon Shareholding
Jun 2023
Sep 2023
Dec 2023
Mar 2024
Jun 2024
Promoters
73.18%
73.18%
65.17%
65.17%
65.17%
Retail and Other
20.86%
22.44%
29.78%
28.92%
27.76%
Foreign Institutions
5.17%
4.01%
4.11%
4.58%
7.17%
Mutual Funds
0.02%
0.48%
0.45%
1.67%
Other Domestic Institutions
0.78%
0.34%
0.46
0.87%
1.23%
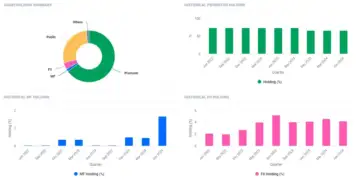
The Ircon shareholding chart is referred to from the Groww website.
Ircon Company Balance Sheet
Balance Sheet of Ircon International (in Rs. Cr.) | Mar 24 | Mar 23 | Mar 22 | Mar 21 | Mar 20 |
12 mths | 12 mths | 12 mths | 12 mths | 12 mths | |
EQUITIES AND LIABILITIES | |||||
SHAREHOLDER'S FUNDS | |||||
Equity Share Capital | 188.1 | 188.1 | 188.1 | 94.05 | 94.05 |
Total Share Capital | 188.1 | 188.1 | 188.1 | 94.05 | 94.05 |
Reserves and Surplus | 5,583.66 | 4,990.38 | 4,432.86 | 4,312.43 | 4,067.08 |
Total Reserves and Surplus | 5,583.66 | 4,990.38 | 4,432.86 | 4,312.43 | 4,067.08 |
Total Shareholders Funds | 5,771.76 | 5,178.48 | 4,620.96 | 4,406.48 | 4,161.13 |
NON-CURRENT LIABILITIES | |||||
Long Term Borrowings | 0 | 0 | 0 | 0 | 1,845.92 |
Deferred Tax Liabilities [Net] | 0 | 0 | 0 | 0 | 0 |
Other Long Term Liabilities | 1,701.29 | 1,412.66 | 559.49 | 599.91 | 655.13 |
Long Term Provisions | 142.37 | 119.69 | 79.7 | 79.11 | 78.66 |
Total Non-Current Liabilities | 1,843.66 | 1,532.35 | 639.19 | 679.02 | 2,579.71 |
CURRENT LIABILITIES | |||||
Short Term Borrowings | 0 | 0 | 0 | 0 | 0 |
Trade Payables | 854.37 | 811.41 | 1,010.33 | 737.9 | 576.85 |
Other Current Liabilities | 5,353.14 | 5,953.12 | 6,245.96 | 4,638.91 | 5,102.35 |
Short Term Provisions | 261.2 | 201.05 | 211.04 | 202.18 | 224.07 |
Total Current Liabilities | 6,468.71 | 6,965.58 | 7,467.33 | 5,578.99 | 5,903.27 |
Total Capital And Liabilities | 14,084.13 | 13,676.41 | 12,727.48 | 10,664.49 | 12,644.11 |
ASSETS | |||||
NON-CURRENT ASSETS | |||||
Tangible Assets | 191.8 | 183.05 | 192.72 | 259.43 | 275.81 |
Intangible Assets | 8.9 | 8.69 | 0.44 | 0.25 | 0.4 |
Capital Work-In-Progress | 6.56 | 0 | 0 | 0.27 | 0.66 |
Other Assets | 543.07 | 552.31 | 555.18 | 511.01 | 489.02 |
Fixed Assets | 750.33 | 746.64 | 758.13 | 780.75 | 775.68 |
Non-Current Investments | 2,275.88 | 2,037.60 | 1,714.19 | 1,505.58 | 1,468.52 |
Deferred Tax Assets [Net] | 123.33 | 114.6 | 84.15 | 82.56 | 93.68 |
Long Term Loans And Advances | 279.1 | 315.84 | 283.47 | 1,385.18 | 1,409.68 |
Other Non-Current Assets | 330.35 | 114.16 | 47.9 | 121.67 | 2,131.84 |
Total Non-Current Assets | 3,758.99 | 3,328.84 | 2,887.84 | 3,875.74 | 5,879.40 |
CURRENT ASSETS | |||||
Current Investments | 563.51 | 99.99 | 50 | 0 | 0 |
Inventories | 232.37 | 206.44 | 272.26 | 117.6 | 320.66 |
Trade Receivables | 946.46 | 868.73 | 709.16 | 504.64 | 559.34 |
Cash And Cash Equivalents | 4,429.13 | 4,785.32 | 5,339.97 | 3,250.46 | 2,500.88 |
Short Term Loans And Advances | 35.8 | 30.14 | 31.65 | 94.04 | 62.8 |
OtherCurrentAssets | 4,117.87 | 4,356.95 | 3,436.60 | 2,822.01 | 3,321.03 |
Total Current Assets | 10,325.14 | 10,347.57 | 9,839.64 | 6,788.75 | 6,764.71 |
Total Assets | 14,084.13 | 13,676.41 | 12,727.48 | 10,664.49 | 12,644.11 |
OTHER ADDITIONAL INFORMATION | |||||
CONTINGENT LIABILITIES, COMMITMENTS | |||||
Contingent Liabilities | 7,597.61 | 8,188.56 | 3,617.26 | 2,654.27 | 2,607.79 |
CIF VALUE OF IMPORTS | |||||
Raw Materials | 0 | 0 | 0 | 0 | 0 |
Stores, Spares And Loose Tools | 0 | 0 | 0 | 0 | 0 |
Trade/Other Goods | 0 | 0 | 0 | 0 | 0 |
Capital Goods | 0 | 0 | 0 | 0 | 0 |
EXPENDITURE IN FOREIGN EXCHANGE | |||||
Expenditure In Foreign Currency | 553.23 | 406.83 | 467.1 | 515.55 | 525.67 |
REMITTANCES IN FOREIGN CURRENCIES FOR DIVIDENDS | |||||
Dividend Remittance In Foreign Currency | -- | -- | -- | -- | -- |
EARNINGS IN FOREIGN EXCHANGE | |||||
FOB Value Of Goods | -- | -- | -- | -- | -- |
Other Earnings | 622.66 | 432.99 | 521.26 | 561.03 | 540.62 |
BONUS DETAILS | |||||
Bonus Equity Share Capital | 178.69 | 178.69 | 178.69 | 84.64 | 84.64 |
NON-CURRENT INVESTMENTS | |||||
Non-Current Investments Quoted Market Value | 130.43 | 130.41 | 252.66 | 343.48 | 322.13 |
Non-Current Investments Unquoted Book Value | 2,150.69 | 1,912.40 | 1,489.01 | 1,214.12 | 1,177.07 |
CURRENT INVESTMENTS | |||||
Current Investments Quoted Market Value | 563.5 | 109.93 | -- | -- | -- |
Current Investments Unquoted Book Value | -- | -- | -- | -- | -- |
Balance Sheet of Ircon International (in Rs. Cr.)
Mar 24
Mar 23
Mar 22
Mar 21
Mar 20
12 mths
12 mths
12 mths
12 mths
12 mths
EQUITIES AND LIABILITIES
SHAREHOLDER'S FUNDS
Equity Share Capital
188.1
188.1
188.1
94.05
94.05
Total Share Capital
188.1
188.1
188.1
94.05
94.05
Reserves and Surplus
5,583.66
4,990.38
4,432.86
4,312.43
4,067.08
Total Reserves and Surplus
5,583.66
4,990.38
4,432.86
4,312.43
4,067.08
Total Shareholders Funds
5,771.76
5,178.48
4,620.96
4,406.48
4,161.13
NON-CURRENT LIABILITIES
Long Term Borrowings
0
0
0
0
1,845.92
Deferred Tax Liabilities [Net]
0
0
0
0
0
Other Long Term Liabilities
1,701.29
1,412.66
559.49
599.91
655.13
Long Term Provisions
142.37
119.69
79.7
79.11
78.66
Total Non-Current Liabilities
1,843.66
1,532.35
639.19
679.02
2,579.71
CURRENT LIABILITIES
Short Term Borrowings
0
0
0
0
0
Trade Payables
854.37
811.41
1,010.33
737.9
576.85
Other Current Liabilities
5,353.14
5,953.12
6,245.96
4,638.91
5,102.35
Short Term Provisions
261.2
201.05
211.04
202.18
224.07
Total Current Liabilities
6,468.71
6,965.58
7,467.33
5,578.99
5,903.27
Total Capital And Liabilities
14,084.13
13,676.41
12,727.48
10,664.49
12,644.11
ASSETS
NON-CURRENT ASSETS
Tangible Assets
191.8
183.05
192.72
259.43
275.81
Intangible Assets
8.9
8.69
0.44
0.25
0.4
Capital Work-In-Progress
6.56
0
0
0.27
0.66
Other Assets
543.07
552.31
555.18
511.01
489.02
Fixed Assets
750.33
746.64
758.13
780.75
775.68
Non-Current Investments
2,275.88
2,037.60
1,714.19
1,505.58
1,468.52
Deferred Tax Assets [Net]
123.33
114.6
84.15
82.56
93.68
Long Term Loans And Advances
279.1
315.84
283.47
1,385.18
1,409.68
Other Non-Current Assets
330.35
114.16
47.9
121.67
2,131.84
Total Non-Current Assets
3,758.99
3,328.84
2,887.84
3,875.74
5,879.40
CURRENT ASSETS
Current Investments
563.51
99.99
50
0
0
Inventories
232.37
206.44
272.26
117.6
320.66
Trade Receivables
946.46
868.73
709.16
504.64
559.34
Cash And Cash Equivalents
4,429.13
4,785.32
5,339.97
3,250.46
2,500.88
Short Term Loans And Advances
35.8
30.14
31.65
94.04
62.8
OtherCurrentAssets
4,117.87
4,356.95
3,436.60
2,822.01
3,321.03
Total Current Assets
10,325.14
10,347.57
9,839.64
6,788.75
6,764.71
Total Assets
14,084.13
13,676.41
12,727.48
10,664.49
12,644.11
OTHER ADDITIONAL INFORMATION
CONTINGENT LIABILITIES, COMMITMENTS
Contingent Liabilities
7,597.61
8,188.56
3,617.26
2,654.27
2,607.79
CIF VALUE OF IMPORTS
Raw Materials
0
0
0
0
0
Stores, Spares And Loose Tools
0
0
0
0
0
Trade/Other Goods
0
0
0
0
0
Capital Goods
0
0
0
0
0
EXPENDITURE IN FOREIGN EXCHANGE
Expenditure In Foreign Currency
553.23
406.83
467.1
515.55
525.67
REMITTANCES IN FOREIGN CURRENCIES FOR DIVIDENDS
Dividend Remittance In Foreign Currency
--
--
--
--
--
EARNINGS IN FOREIGN EXCHANGE
FOB Value Of Goods
--
--
--
--
--
Other Earnings
622.66
432.99
521.26
561.03
540.62
BONUS DETAILS
Bonus Equity Share Capital
178.69
178.69
178.69
84.64
84.64
NON-CURRENT INVESTMENTS
Non-Current Investments Quoted Market Value
130.43
130.41
252.66
343.48
322.13
Non-Current Investments Unquoted Book Value
2,150.69
1,912.40
1,489.01
1,214.12
1,177.07
CURRENT INVESTMENTS
Current Investments Quoted Market Value
563.5
109.93
--
--
--
Current Investments Unquoted Book Value
--
--
--
--
--
This balance sheet is referred to from the MoneyControl website.
Vodafone Idea Share Price Target
Conclusion
Do you want to invest in the infrastructure sector? IRCON presents a great opportunity. Due to favorable government policies, planned strategic growth, and consistent performance, the firm is expected to prosper over the next ten years. However, investors need to do their research and consider market risks, as they would with any other investment.
FAQs
1. What does the IRCON company do?
Railways, which include new railway lines, existing line rehabilitation/conversion, station buildings and amenities, bridges, tunnels, signaling and telecommunication, railway electrification, and wet leasing of locomotives, are areas of expertise for IRCON, which is a turnkey construction business.
2. Who is the owner of IRCON?
Ministry of Railways India.
3. Is IRCON share good for long term?
Consistently improving annual net profit: For the past two years, IRCON International has consistently reported an increase in net profit, which may please investors looking for a long-term commitment.
4. Can I invest in IRCON?
By creating a demat account with trading apps or your share market broker, you can buy shares of IRCON International Limited (IRCON).
Disclaimer
This article is just for informational purposes. Forecasting of the share price targets is based on and referred to from various sources, media reports, and predictions done by brokerage houses from time to time.
We also state that we are not SEBI-registered financial advisors. So, kindly, before taking any kind of investment in the shares, please do counsel with the certified financial advisories.
If you have any corrections or find any wrong information, do let us know at our official [email protected].