
Memory-Dump Debugging helps Java developers analyze application states to identify and resolve complex bugs.

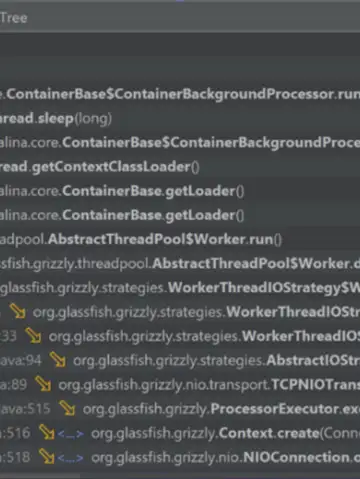
Replay Debugging replays execution paths, enabling developers to trace bugs back to their root cause.

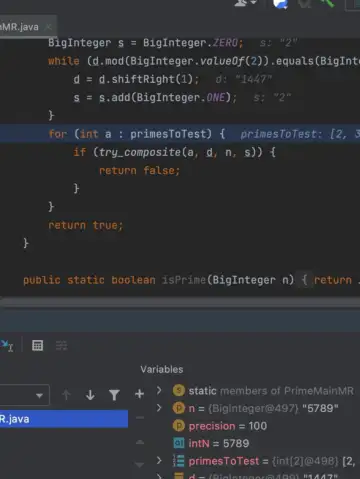
Conditional Breakpoints pause execution only when specific conditions are met, optimizing debugging efficiency.
Profiling tools like VisualVM and JProfiler allow developers to diagnose performance issues and memory leaks.
Robust logging strategies provide context, helping developers understand and resolve bugs more effectively.