


Bitcoin's outlook remains the subject of interest among investors since volatility has been influencing sentiment. In an
Cycle Psychology Indicates Bull Market Continuation
Nehal states that Bitcoin has already gone through the critical psychological stages, which normally precede sharp rallies.
February was a bear trap, where prices remained subdued, and investors believed that any kind of bounce could not be sustained. The accumulation of smart money likely occurred during this period.
March was a shakeout month, when weak hands were quitting positions in a volatile environment. With a drop in the selling pressure, the mood slowly changed to optimism, setting the stage for a more widespread rally.
This pattern is consistent with the past Bitcoin cycles, in which late-stage accumulation is usually followed by an explosive rise.
April Rotation Signals Rising Risk Appetite
In April, Nehal highlights the start of an altcoin-driven cycle, where capital is shifting out of Bitcoin and into more risky assets. This phase is generally driven by confidence and speculation.
The excitement and FOMO are the leading psychological factors in the market since traders start making longer positions.
Although this is beneficial in the direction of upward momentum, it also leads to increased volatility as leverage builds across the market.
$215K Target and Euphoria Phase
Nehal estimates that by May, Bitcoin could hit a high of $215,000. This stage is likely to be marked by the highest levels of euphoria as late movers violently enter the rally and early movers start to cash out.
But instability is often preceded by this phase. There is a possible bull trap in June that may lure traders to think that the rally will be sustained when the reality is that the market is actually weak. By July and August, the market can be in a distribution stage, and the large holders will slowly exit, which can be a catalyst for a broader correction.
Current Technical Structure
Technically, BTC is trading at $71,779, up 4.75%. BTC holds in the upper half of a channel capped near $72,600, with a slightly bullish near-term bias. BTC has reclaimed the 50-day EMA around $70,500, turning it into dynamic support.
The Moving Average Convergence Divergence (MACD) histogram has flipped positive as the MACD line advances above the signal line. The Relative Strength Index (RSI) at 58.58 remains above its midline, signaling that buyers retain momentum.
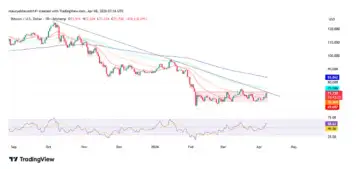
Immediate resistance is near the channel top at $72,600, and a daily close above this level could open the way toward $74,800. A failure under $72,600 would keep BTC confined to the channel, with immediate support near $70,500.