

Intel Corp. (NASDAQ:INTC) is up 47% this month. The last time it did that was January 1987.
The chipmaker is on track to its best single month in nearly four decades after a cascade of catalysts ranging from the Terafab AI manufacturing partnership to analyst upgrades.
Since the stock went public in 1972, a monthly rally of 45% or more has happened exactly five times, including now.
The key question right now: Is this a rally to chase - or to doubt?
A Signal So Rare It Only Happened 4 Times Before
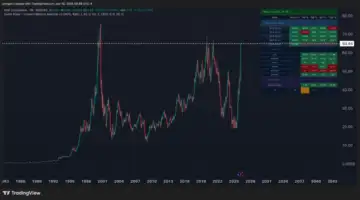
The TradingView forward-returns event study - which scans every monthly candle in Intel's recorded history for rallies of 45% or more - surfaces just four completed historical instances before the current one.
Each episode unfolded during periods of severe dislocations: the early-1970s bear market, the 1974 oil-shock recovery, and the aftermath of Black Monday in 1987.
The event-study data - what statisticians call a "forward return analysis" - measures how the stock performed in the months after each signal triggered.
Think of it as asking: every time Intel did this before, what happened next?
| Episode | Move % | 1M % | 3M % | 6M % | 12M % |
|---|---|---|---|---|---|
| July 1973 | +62.7% | +38.5% | +20.2% | +89.0% | −17.4% |
| October 1974 | +63.0% | −11.8% | +1.7% | +121.0% | +142.0% |
| February 1975 | +47.1% | +18.5% | +57.3% | +66.9% | +144.9% |
| January 1987 | +48.8% | +21.6% | +50.4% | +52.8% | +22.4% |
| April 2026 ← Current | +47.2% | - | - | - | - |
| AVG (prior 4) | - | +16.7% | +32.4% | +82.4% | +73.0% |
| MEDIAN | - | +20.1% | +35.3% | +77.9% | +82.2% |
| WIN RATE | - | 75% | 100% | 100% | 75% |
The numbers are striking.
In the three- and six-month periods following a 45% monthly rally, Intel has been higher every single time - a 100% win rate across just four prior episodes. The median six-month gain across those episodes was 77.9%. The median 12-month return was 82.2%.
The momentum playbook says: when Intel does this, it tends not to stop.
The Valuation Wall: Intel Is Now The 4th Most Expensive S&P 500 Stock
Here is the tension.
Intel now trades at 125.2 times forward earnings - the fourth-highest forward price-to-earnings multiple in the entire S&P 500, surpassing even Palantir Technologies Inc.(NASDAQ:PLTR), which has long been the poster child for AI-premium valuations.
Forward P/E, also called next-twelve-months P/E, is calculated by dividing a company's current stock price by the earnings analysts expect it to generate over the next 12 months.
A ratio of 125x means investors are paying $125 for every $1 of expected profit - a level that only makes sense if future earnings grow dramatically to justify the price paid today.
| Company | Analyst Med. Target | Fwd P/E (NTM) |
|---|---|---|
| Tesla Inc. | +12.5% | 193.4x |
| Alexandria Real Estate Equities Inc. | +22.9% | 180.9x |
| Ventas Inc. | +9.6% | 126.7x |
| Intel Corp. ← #4 | −23.0% | 125.2x |
| Palantir Technologies Inc. | +40.0% | 107.5x |
What separates Intel from the other names on that list is the direction of analyst price targets.
Tesla, Alexandria Real Estate, and Palantir all have median consensus targets above current prices - meaning analysts, on balance, still see more upside from here despite elevated valuations.
Intel is the lone stock in that elite, expensive club where the consensus actually points downward: the median analyst price target of $51.35 sits 23% below where the stock closed on Wednesday.
The average target is $51.35, implying roughly 21% downside on a mean-reversion basis.
What Drove The Rally - And Whether It Lasts
The April surge was not random.
Intel's involvement in the Terafab project - the Elon Musk-backed mega-fabrication initiative launched in March 2026 that brings together SpaceX, Tesla, and xAI to produce AI compute at scale - combined with a confirmed multi-billion-dollar foundry deal with Amazon Web Services, reframed the company as an AI infrastructure player rather than a PC-era relic.
Upgrades followed.
Benchmark raised its price target from $57 to $76. citing the company's growing traction in AI foundry services and the validation of its 18A manufacturing process through the Terafab partnership.
Melius Research moved Intel's 12-month target from $58 to $75.
Northland set a target of $92 - the highest on the Street. Wells Fargo & Co. lifted its target from $45 to $55 while retaining an equal-weight rating. According to Wells Fargo, the stock's current premium to consensus targets historically precedes periods of elevated volatility around earnings catalysts.
The upgrade cycle created a feedback loop: higher targets attracted momentum buyers, who in turn drove more upgrades.
What This Means For Investors
The historical playbook after similar monthly spikes is genuinely bullish.
Every prior instance of a greater than 45% monthly rally in Intel's history produced positive returns three and six months later, with median six-month gains of nearly 78%.
Momentum of this magnitude, once established, historically does not simply evaporate.
But momentum cuts both ways when valuation has raced ahead. The October 1974 episode - where Intel surged 63% in a single month - produced 121% returns over the following six months.
The July 1973 episode, by contrast, was followed by a -17.4% return over the next 12 months.
The signal is powerful, but not infallible.
Intel's earnings report on April 23 is the next binary event.
Consensus expects revenue of roughly $12.3 billion for first quarter 2026. A beat that validates the foundry ramp could push the stock higher. A miss - or cautious guidance on Intel Foundry margins - could accelerate the mean-reversion that the median analyst is implicitly pricing in.
The momentum says: Intel extended it. The valuation says: Intel exceeded it. Both can be true at the same time - until April 23.
Photo: Shutterstock