




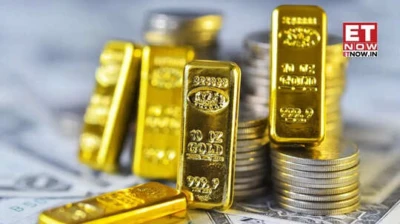

Gold Supercycle 2026: Markets may be approaching a rare historical turning point. Emerging signals suggest a potential shift away from equity dominance toward hard assets such as gold, commodities, and energy, an environment typically associated with inflationary cycles or periods of economic stress.
Gold/SPX ratio signals change
A recent report by Kedia Stocks and Commodities points to a key indicator supporting this view, which is the rising Gold/SPX ratio. This metric, which compares the price of gold to the level of the S&P 500 Index, provides a clear lens into the relative performance of gold versus US equities.
An upward trend in this ratio indicates that gold is beginning to outperform stocks. Historically, such phases have coincided with heightened inflation, currency debasement concerns, or broader financial uncertainty, periods when investors tend to rotate toward tangible assets over financial ones.
The report further highlights a more nuanced signal: the True Strength Index (TSI). When applied to a long-term (5-month) chart of the Gold/SPX ratio, the TSI is described as a rare indicator. Taken together, these signals suggest that the current environment may not just be a short-term divergence, but the early stages of a broader structural rotation in global markets.
Also Read: Govt allows 15 banks, including SBI, HDFC Bank and Axis Bank, to import gold and silver - Check timeline
Historical precedents of gold outperformance
The report also reveals that in history, this has been witnessed on 4 occasions:
1931-1934
The first significant surge came in the early 1930s, at the time of the Great Depression. As equity markets collapsed and confidence in financial systems eroded, gold gained prominence. In 1934, US President Franklin D Roosevelt revalued gold from USD 20 to USD 35 per ounce.
1965-1980
A far more dramatic rally unfolded between 1965 and 1980. Mounting fiscal strain from the Vietnam War and growing imbalances in the global monetary system led to the collapse of the Bretton Woods system. Under President Richard Nixon, the United States ended the dollar's convertibility into gold in 1971, effectively allowing gold to trade freely in international markets. Prices subsequently soared from USD 35 to USD 850 per ounce, marking the most explosive bull market in the metal's history.
2001-2011
More recently, gold entered another prolonged rally between 2001 and 2011. The burst of the dot-com bubble and the shock of the September 11 attacks prompted central banks to adopt loose monetary policies. Coupled with rising global demand, these conditions pushed gold prices from USD 255 to a record USD 1,920 per ounce. The rally eventually peaked as the US Federal Reserve began to shift toward tighter monetary policy.
2023 - Now
Now, a new phase may be emerging. The current period is showing early signs of a similar transition. The report points towards structural themes such as de-dollarisation, record levels of central bank gold purchases, and persistently high fiscal deficits as key drivers underpinning the market. However, the report also reveals that it remains early, the signal suggests that momentum may be building for another extended rally.
Gold near-term outlook
Market expert Ajay Kedia expects gold to trade between USD 3,450 and USD 4,100 over the next two to three months, before a potential rally toward USD 8,000. Prices hit record highs in January 2026, while strong inflows into Gold ETFs continue supporting bullish sentiment.
Also Read: Gold Rate Today, April 20: Price slips over Rs 1600 on MCX as US-Iran tensions escalate; Check 24K, 22K rates in your city
(Disclaimer: The above article is meant for informational purposes only, and should not be considered as any investment advice. ET NOW DIGITAL suggests its readers/audience to consult their financial advisors before making any money-related decisions.)
Read more news like this on www.etnownews.com