


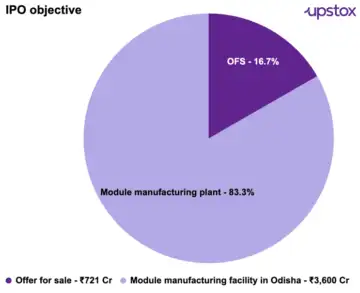
Waaree Energies Limited (WEL) is planning to raise ₹4,321 crore. The fresh funds will be used for establishing a 6 GW solar module, ingot, and cell plant in Odisha eventually helping the company in backward integration.
Source: Waaree Energies RHP
Industry insights
India's power capacity increased to around 442 GW by March 2024 from 343 GW in 2019, with the largest contribution coming from solar energy.
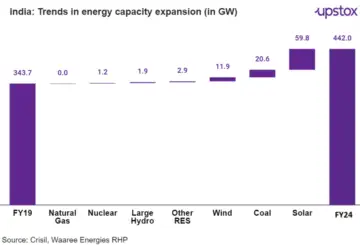
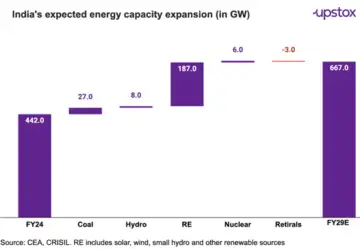
By 2029, renewable capacity is expected to exceed 320 GW, making up about 50% of the projected 660-670 GW total capacity. To understand more about India's solar capacity additions - please read Chasing the sun
Solar Photovoltaic (PV) module industry
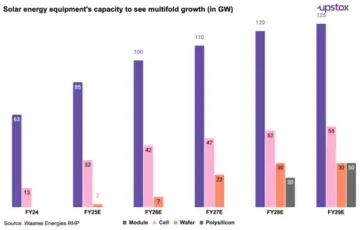
By FY29, India's solar PV (solar panels) manufacturing capacity is set to reach 125 GW, necessitating investments of ₹17 lakh crore for complete integration as per Crisil. Currently, India imports upto 85% of its solar modules due to insufficient domestic manufacturing capacity.
As such, this expansion is poised to generate business opportunities worth ₹3.4 Lakh crore from FY25-30, per the same report.
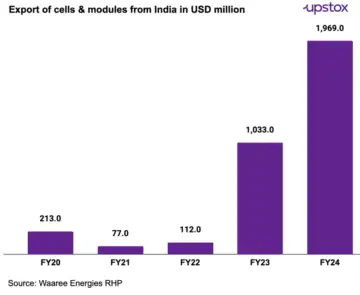
In fiscal 2023, India's solar module exports surged due to restrictions on Chinese products, allowing Indian manufacturers to capture a larger share of the global market.
Following government incentives are some of the key growth drivers for the solar PV sector:
Domestic content requirement (DCR): Mandates the use of domestically manufactured solar components in various government schemes, with financial assistance to bridge the cost gap between domestic and imported products.
PLI scheme: Offers financial incentives based on the production of high-efficiency solar PV modules and cells, with ₹240 billion allocated across two tranches to enhance domestic manufacturing.
Import duty: Imposed custom duty on solar module and cell imports from April 2022 to encourage local production.
Approved list of models and manufacturers (ALMM): Ensures only certified solar products are used in government projects, promoting quality and domestic manufacturing.
PM-KUSUM scheme: Provides subsidies for solar agricultural pumps and small-scale solar plants, aiming to reduce diesel use and increase farmer income.
About Waaree Energies Limited (WEL)
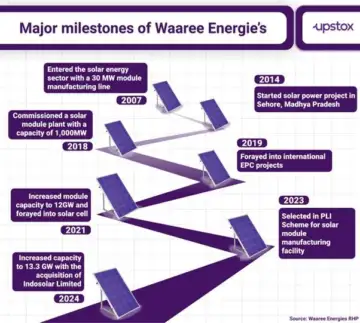
Established in 1990, WEL has grown to become India's top producer and exporter of solar modules or panels.
From FY20-24, WEL expanded its production capacity by 6x to reach 13.3 GW, securing a 21% market share domestically and a 44% market share in solar module exports.
WEL is in the process of developing an 11.4 GW manufacturing complex, (which includes solar panel, solar cell, ingot, and wafer production facility) expected to be completed by FY25E.
Business Overview
WEL has a comprehensive suite of solar energy offerings:
Solar modules manufacturing: Produces variety of solar modules
EPC and O&M services: Provides engineering, procurement, and construction services for project installations along with operations and maintenance services.
Power generation: Operates as an independent power producer with a network of solar power plants.
The majority of the revenue comes from solar modules. Consequently, the segment has the highest asset deployment. We are also encouraged to the note healthy ROAs across most segments.
| Particulars | Solar module | Power generation | EPC |
|---|---|---|---|
| Revenue (in ₹ cr) | 10,522.6 | 28.6 | 846.3 |
| Contribution to revenue | 92.3% | 0.3% | 7.4% |
| Segment EBITDA (in ₹ cr) | 1,363.6 | 27.8 | 179.2 |
| Segment Margin | 13.0% | 97.2% | 21.2% |
| Segment Assets (in ₹ cr) | 6,232.1 | 212.2 | 418.3 |
| Segment RoA | 21.9% | 13.1% | 42.8% |
Source: Waaree Energies RHP. Note: unallocated revenue and EBITDA is not included in above segmental performance.
EPC revenues have seen the highest growth between FY22-24 on a smaller base, while Module business grew by 3 times during the same period.
| Segment revenue (in ₹ cr) | FY22 | FY24 | CAGR (%) |
|---|---|---|---|
| Modules | 2,692.5 | 10,522.6 | 97.8% |
| Power generation | 14.4 | 28.6 | 39.4% |
| EPC | 147.2 | 846.3 | 139.9% |
| Total | 2,854.1 | 11,397.6 | 99.8% |
Source: Waaree Energies RHP
Financial & operational performance
The financial metrics show significant growth across key performance indicators over FY22-24.
Revenue from operations has surged nearly 4x and EBITDA margin has doubled.
Net worth has seen a substantial increase which has helped keep the overall Debt to Equity in check.
Additionally, the increase in both capacity (from 4 GW to 13.5 GW) and order book size reflects a growing market presence and stronger demand.
| Particulars | FY22 | FY23 | FY24 |
|---|---|---|---|
| Net worth ₹ cr | 427.3 | 1,825.4 | 4,074.8 |
| Revenue from operations ₹ cr | 2,854.2 | 6,750.8 | 11,397.6 |
| EBITDA Margin % | 6.8% | 13.7% | 15.5% |
| PAT in ₹ cr | 79.6 | 500.2 | 1274.3 |
| Debt to Equity ratio | 0.7 | 0.2 | 0.1 |
| Return on average capital employed | 23.4% | 48.8% | 36.9% |
| Capacity in GW | 4.0 | 9.0 | 13.3 |
| Order Book in GW | 3.3 | 18.1 | 19.9 |
Source: Waaree Energies RHP
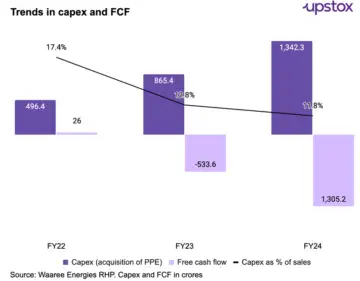
That said, the company has been Free Cash Flow (FCF) negative in the past two years. Despite some decrease in capex intensity, the company's FCF position has deteriorated. While the funds raised from the IPO should help, given its ambitions, capex could remain elevated and thus hurt its cash flow position. WEL's ability to turn FCF positive could remain a key monitorable for investors is expected to remain.
How does WEL stack up against its competitors?
WEL demonstrates strong financial health with a solid EBITDA margin, a low debt-to-equity ratio and a high ROCE.
| Particulars | Waaree Energies | Websol Energy | Premier Energies |
|---|---|---|---|
| Revenue (in ₹ cr) | 11,397.6 | 25.9 | 3,143.8 |
| EBITDA Margin % | 15.5% | -24.5% | 15.5% |
| Debt to Equity ratio | 0.08 | 1.7 | 2.2 |
| RoCE % | 36.9% | -17.6% | 30.1% |
| Installed Capacity in GW | 13.3 | 0.5 | 3.3 |
| Order Book in GW | 19.9 | NA | 54.3 |
| PE Ratio | 31* | NA | 151.4 |
Source: Waaree RHP. *PE valuation for Waaree arrived based on the upper price band of the IPO.
Risk Factors
Here are refined versions of the sentences for clarity and impact:
Competition: The company faces stiff competition from both domestic Indian module manufacturers and international players from China and Southeast Asia.
Government incentives: The company's expansion strategy heavily relies on government incentives. Should these incentives fail to materialise, the company might need to secure additional capital, potentially weakening its financial position.
Order book risk: There is a risk that the company might not convert its order book into revenue due to potential order cancellations.
Geopolitical risk: With 57% of its revenue coming from exports in FY24 and 90% of its raw material costs tied to imports, the company is highly vulnerable to geopolitical tensions and disruptions.
Conclusion
WEL will be an interesting addition to the list of companies that provide renewable energy exposure in India. On the plus side, it has a strong market position, healthy order book, proven project execution track record, among others. Investors could however, keenly track its ability to compete in a very price sensitive segment (especially given the cheap imports) as well as its ability to turn cash flow positive on a sustainable basis.
Disclaimer: This article is for informational purposes only and must not be considered investment advice. Investors should consult with experts before making any investment decisions.
Looking to invest in WEL?